





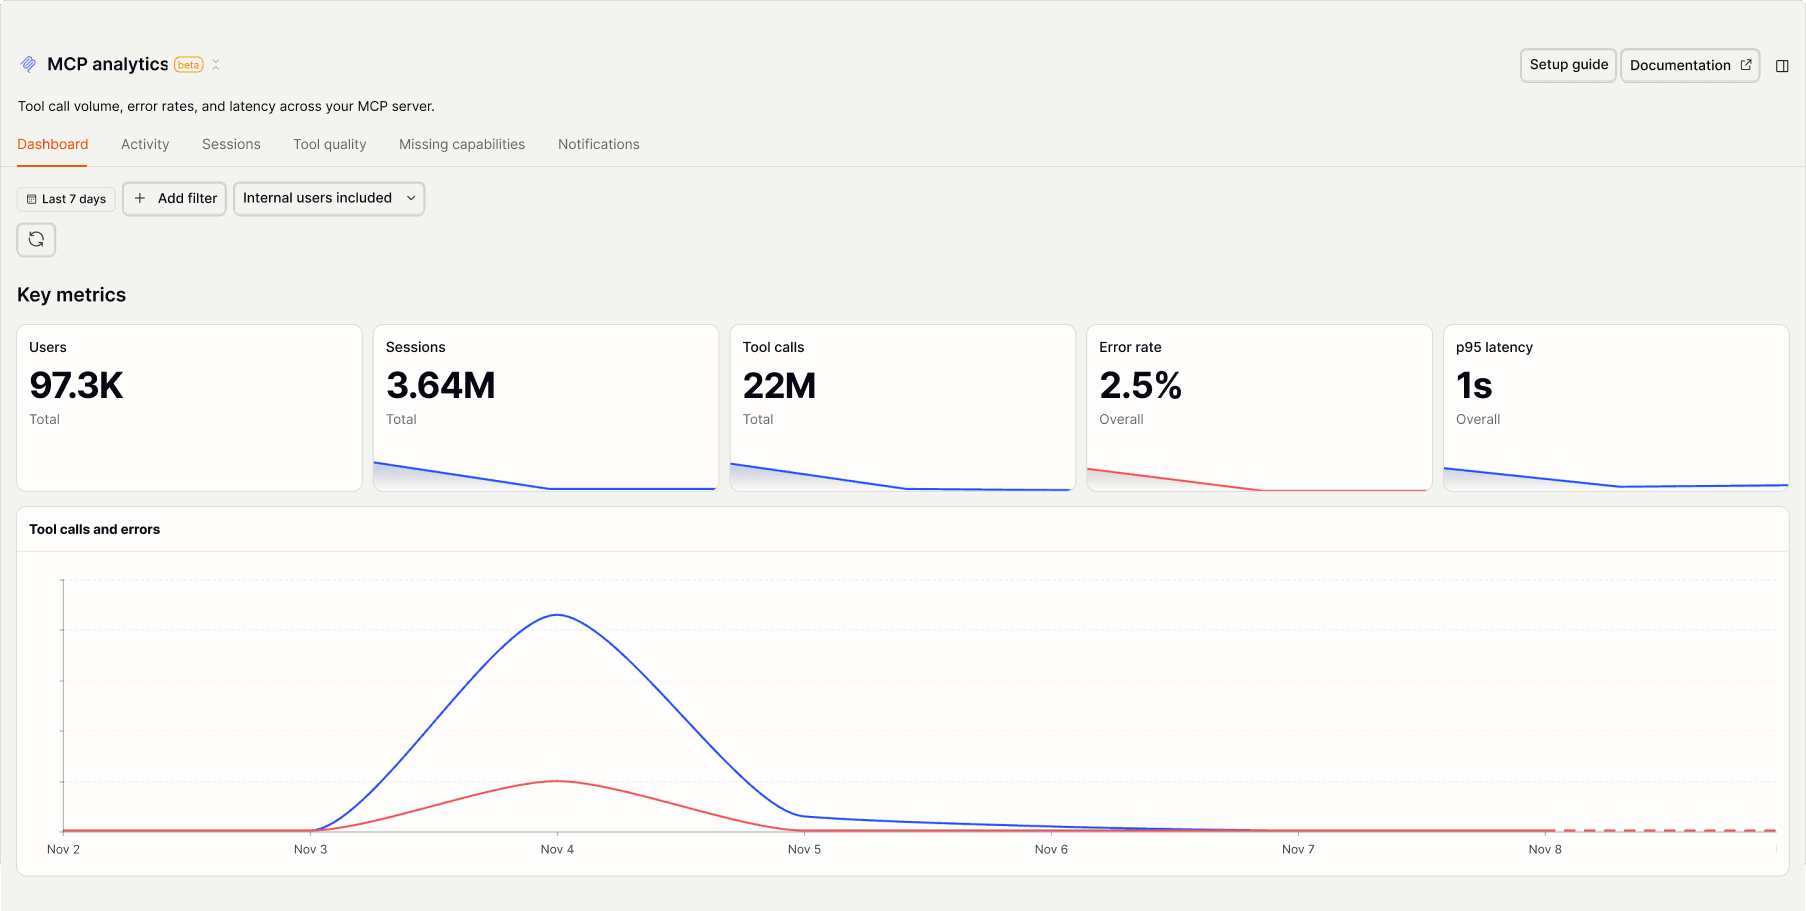
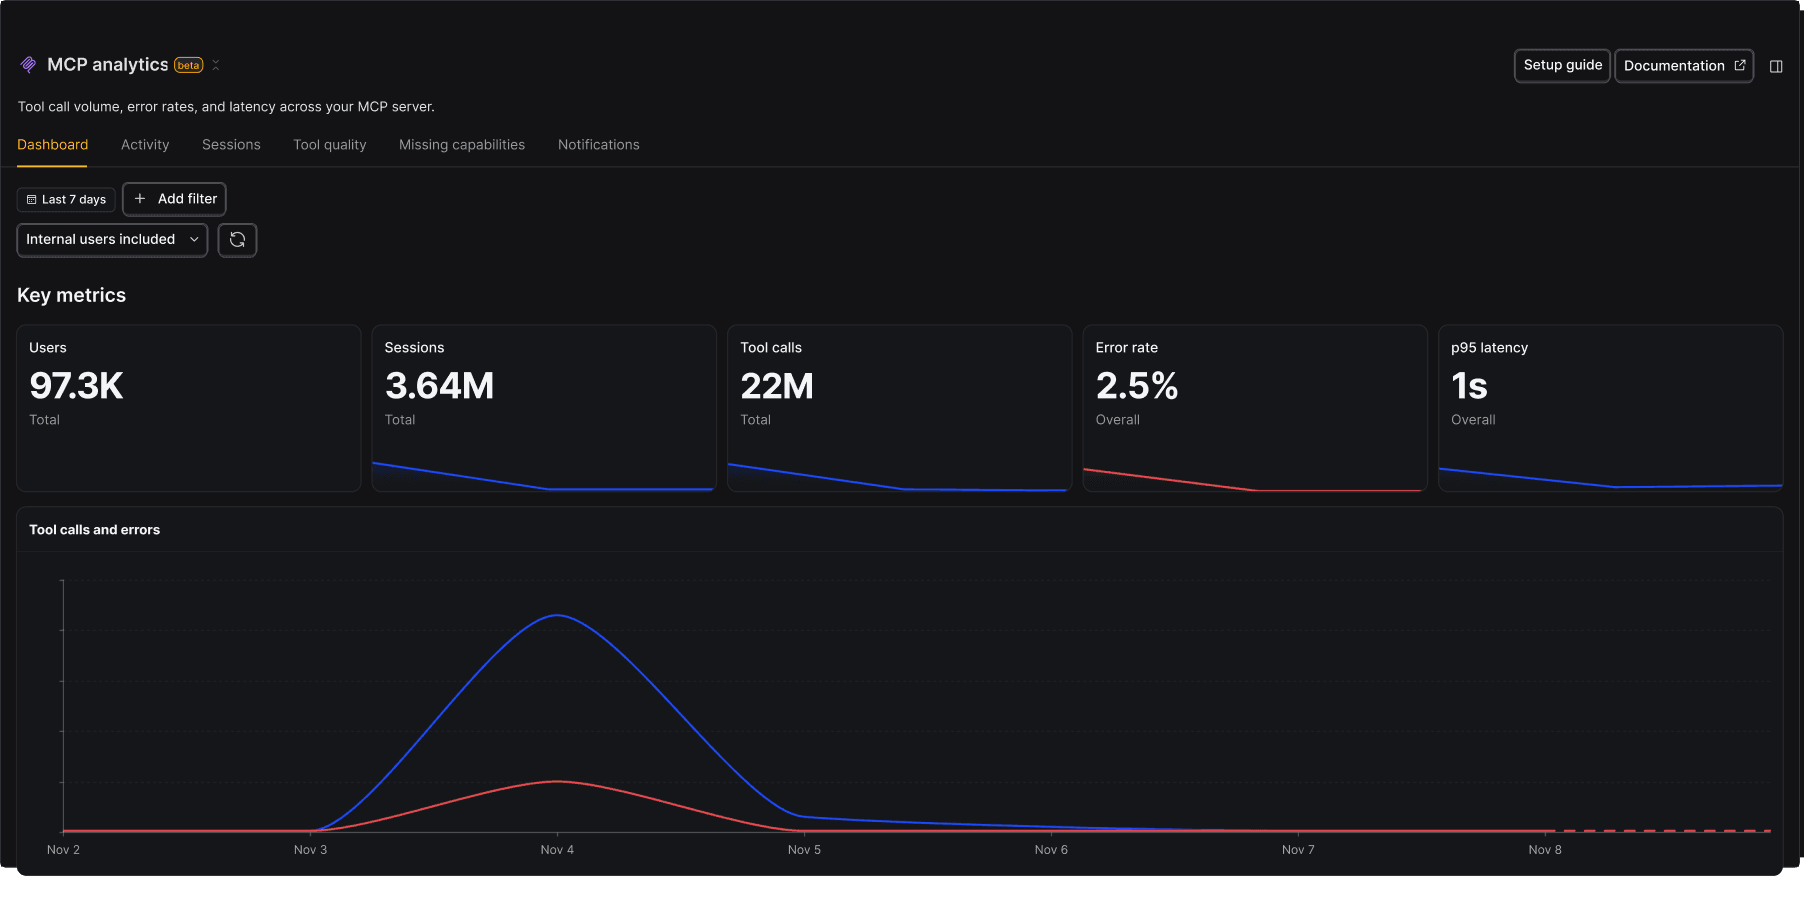
See everything agents do on your MCP server
“Summarize the agent intents behind my top 5 tools.”
Install with AI in a single prompt
Paste into your terminal or code editor and make AI do the work.
What does it do?
MCP Analytics captures every tool call agents make to your MCP server: what they sent, what came back, how long it took and whether it failed. We ask agents why they're calling each tool, so you see the user's goal alongside the call. Sessions tie the calls together, so one agent task reads as a single story.
Who is it for?
How do I use it?
Ask your agent about your MCP server
Don't want to open a dashboard? Query MCP analytics from Claude Code, Cursor, or any client. Ask for this week's errors and slowest tools, then fix them in the same session.
Key features
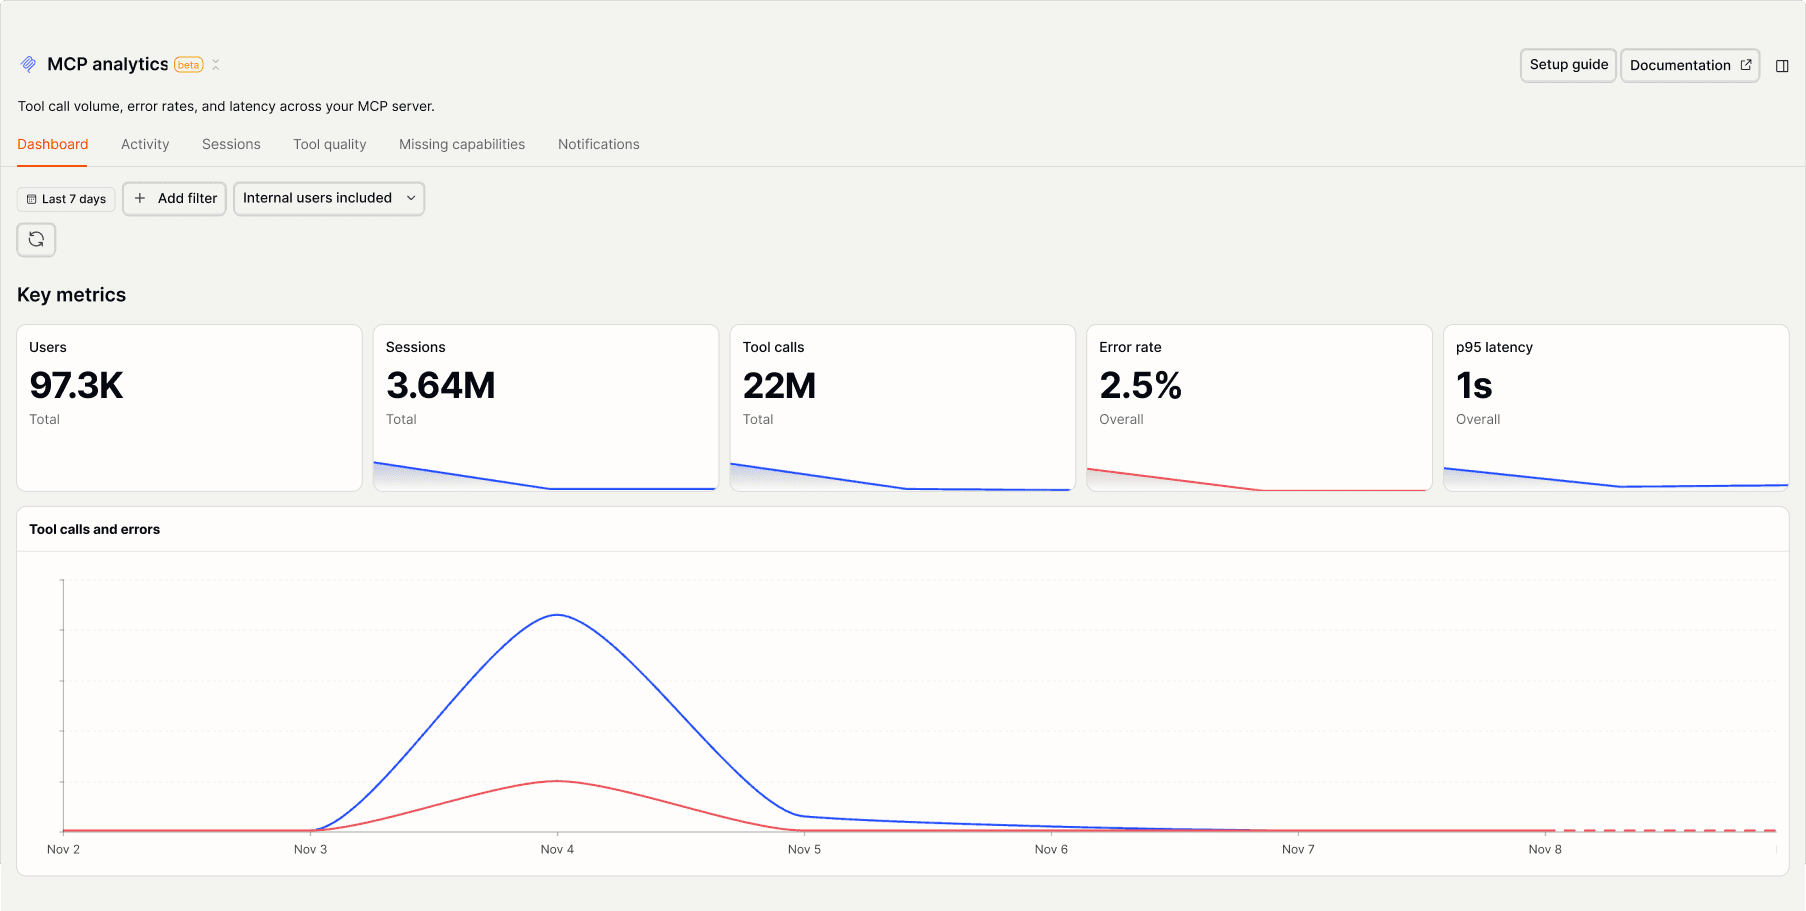
Every tool call
Each tool call becomes an event with response, duration, and errors. See exactly how many tool calls you run and which ones fail.
$exception event so the tool shows up in Error trackingAI prompts
Ask PostHog AI, or your agent through the PostHog MCP server. Start with the usual questions about usage and errors, then go deeper: exact error messages, release checks, clients, and the tools agents never call. Already signed in? Click a prompt to try it.
Usage overviewquery-mcp-tool-stats
Clientsquery-mcp-harness-breakdown
Errorsquery-mcp-tool-failure-occurrences
Release checksquery-mcp-tool-daily-stats
Missing capabilitiesquery-mcp-missing-capabilities
Intentmcp-analytics-intent-clusters-retrieve
Journeysquery-mcp-tool-neighbors
Tool descriptionsquery-mcp-tool-descriptions
Works with other PostHog tools
Use MCP Analytics with these other PostHog apps to maximize shareholder value.
Install
Add the MCP Analytics SDK to your server and wrap it once. The wizard sets up TypeScript and Python servers for you. If you'd rather one-shot it with your own coding agent, every install page has a Markdown version for agents.


Get started – free
No credit card required.